Proof, not promises
Drag the slider. See the difference.
Every engagement starts with an audit of what you're publishing today. These are the same before-and-after comparisons we walk clients through — real social output, real ad stats, real cost per participant enquiry.
0%
Average reach lift
$0
Average cost per enquiry
0+
Participant enquiries generated
0%
Client retention
SIL & SDA vacancies · Western Sydney, NSW
Horizon Living
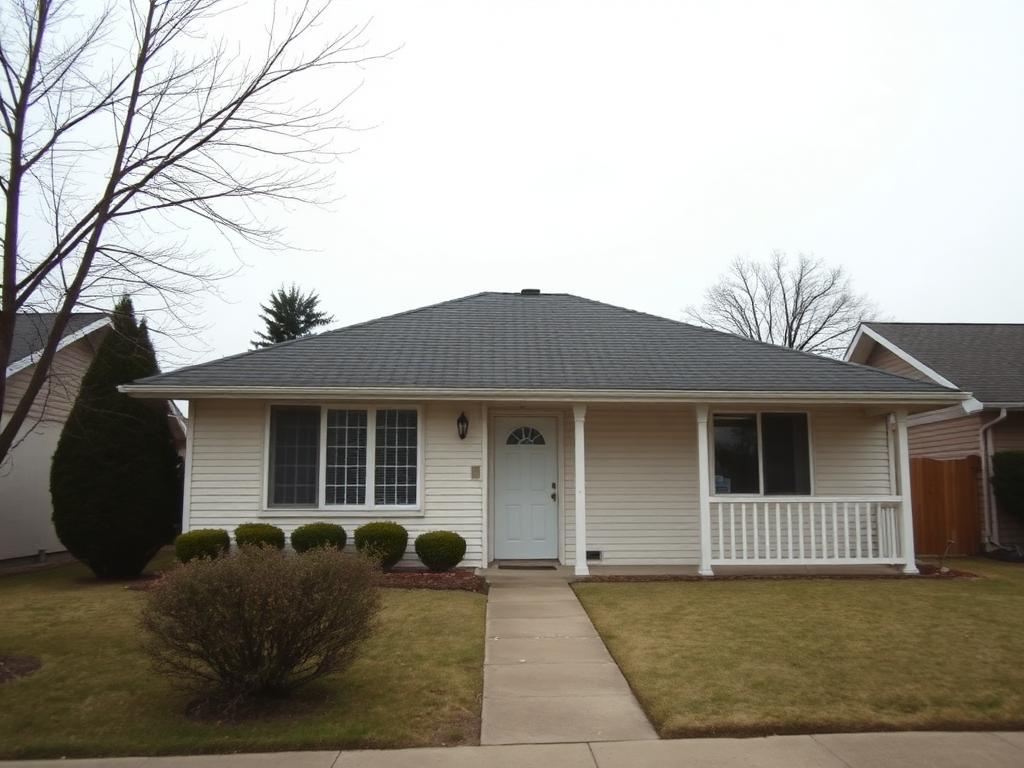
A 40-bed SIL provider with chronic vacancy gaps. We rebuilt their social presence around real house tours and family testimonials, then layered high-intent search ads on top.
@horizonliving
Sponsored · NDIS services

Take a walk through our new Penrith SIL home
Check your eligibility →Short-form house tour with captions, participant-led voiceover and an eligibility check landing page. Published 4x weekly with paid amplification.
Drag the handle (or use arrow keys) to compare.
Performance shift
Monthly reach
0
Before: 3,200
Qualified enquiries / mo
0
Before: 4
Cost per enquiry
$0
Before: $340
Vacancy fill time
0 days
Before: 94 days
Support coordination · Brisbane, QLD
Beacon Support Co.
Referrals were entirely word of mouth. We built an SEO content engine around plan-management questions and a Meta retargeting loop for plan-review season.
@beaconsupportco
Sponsored · NDIS services

3 things to check before your NDIS plan review
Check your eligibility →Educational carousel series answering the questions participants actually search, with a booking link in every slide.

Drag the handle (or use arrow keys) to compare.
Performance shift
Monthly reach
0
Before: 1,800
Organic search clicks / mo
0
Before: 61
New participants / mo
0
Before: 2
Cost per enquiry
$0
Before: $210
OT & physio · Melbourne, VIC
Kinera Allied Health
Long waitlists in one clinic, empty diaries in another. We ran suburb-level campaigns with separate landing pages and live capacity signals.
@kinerahealth
Sponsored · NDIS services

Same-week OT assessments in Footscray
Check your eligibility →Suburb-targeted reels with a therapist on camera, matched to a landing page showing real availability that week.

Drag the handle (or use arrow keys) to compare.
Performance shift
Monthly reach
0
Before: 5,400
Booked assessments / mo
0
Before: 11
Cost per booking
$0
Before: $155
Return on ad spend
0.0x
Before: 1.4x
Live simulator
Model your participant pipeline
Drag the sliders to see how monthly ad spend and engagement length change reach, enquiries and cost per participant lead. Based on live NDIS campaign benchmarks.
Channel mix
Projected over 6 months
Impressions / mo
385,714
Website clicks / mo
14,657
Enquiries / mo
1,378
Cost per enquiry
$2
Estimated new participants onboarded
2,808
At a 34% enquiry-to-participant conversion rate across the engagement.
Projections are modelled estimates based on aggregate NDIS provider campaign data, not a guarantee of results.
Want numbers like these for your service?
We'll audit your current social output and ad account, then show you the projected before-and-after for your own registration groups.